Category Archives: Uncategorized
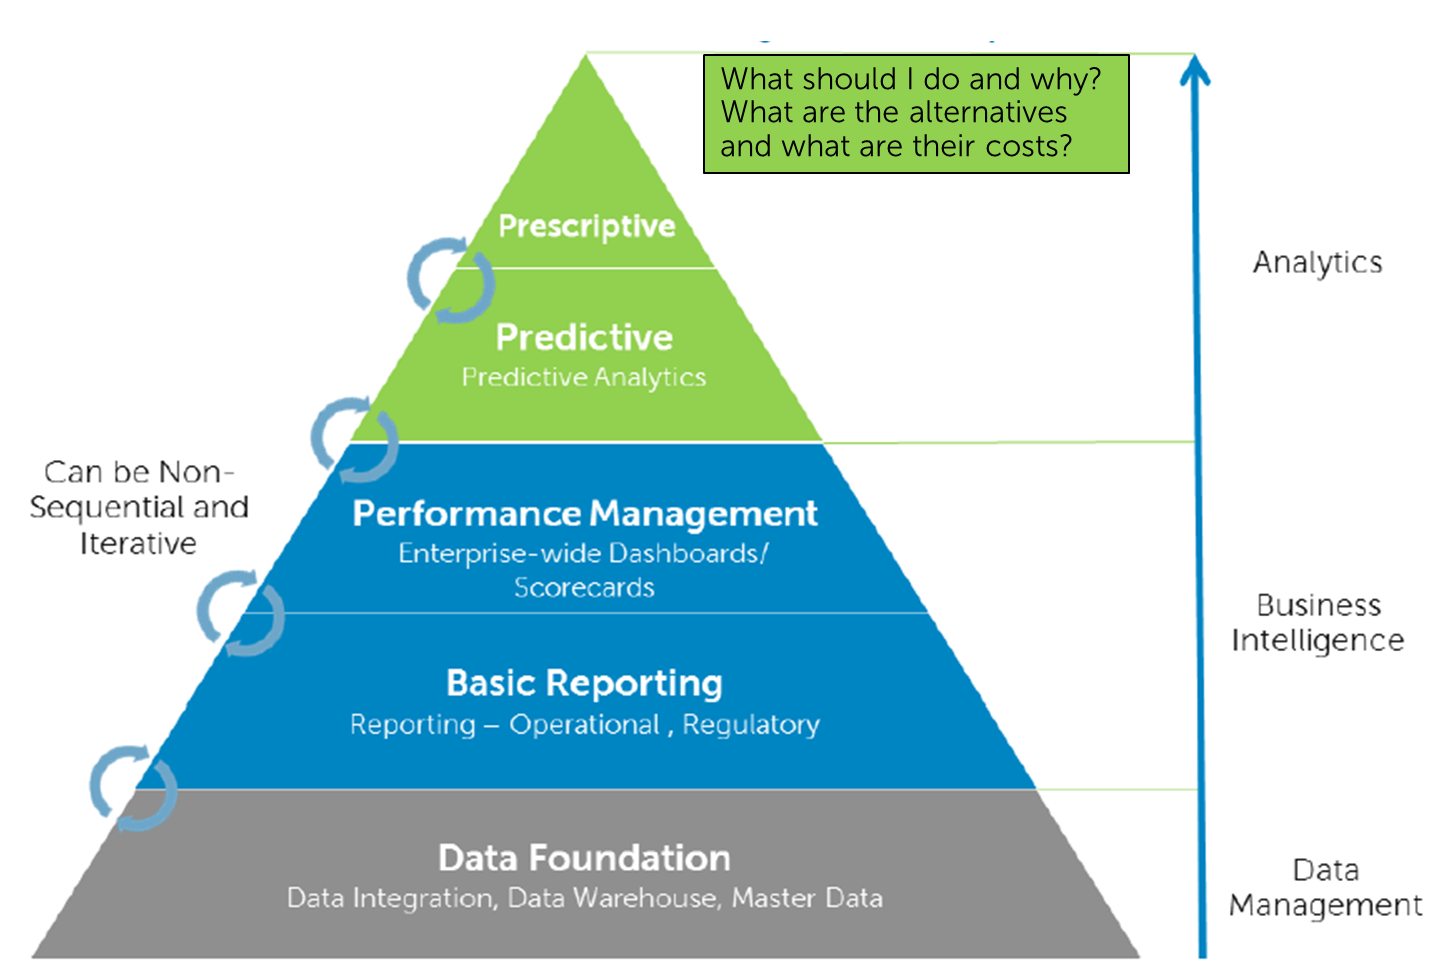
Completing the value chain: data, insight, action

Thomas Hill, Ph.D. Dell Contributor at Tech Page One
The value of effective predictive/prescriptive analytics is easily explained: The best and largest storage capabilities, fastest data access and ETL functionality, and most robust hardware infrastructure will not guarantee success in a highly competitive market place. If, however, one can predict what will happen next – how consumer sentiments will shift, which large insurance claim provides opportunities for subrogation, or how specific changes in the manufacturing process will drastically reduce warranty claims in the field – critical actions can be taken yielding competitive advantages that could pay off within weeks or even days for the entire investment required to achieve those insights.
I sometimes like to point out that I have predicted every stock market crash in the past 30 years – after they happened. Obviously, reporting on what happened to gain insight is interesting and perhaps useful, but the value of predicting outcomes and “pre-acting” rather than reacting to those outcomes can be priceless.
I cannot think of a single successful business that is not continuously working to complete the value chain from the collection of data to predictive modeling, and automating mission critical decisions through effective prescriptive decisioning systems, i.e., some (semi-) automated system by which the best pre-actions to anticipated events and outcomes become part of the routine day-to-day operations and SOPs.
There are near infinite numbers of specific examples. I have had the privilege of collaborating with some brilliant visionaries and practitioners on several books around predictive modeling, the analysis of unstructured data, and (in a forthcoming book) on the application of these technologies to optimize healthcare in various ways. These books describe the near-infinite universe of use cases and examples to illustrate what successful businesses and government agencies are doing today.
When good projects go bad
So what are the real challenges to adopting successfully predictive and prescriptive analytics? The biggest challenge in any such project – in order to incorporate these technologies into mission critical processes – is to complete successfully every single step of the value chain, from data collection, to data storage, data preparation, predictive modeling, validated analytic reporting, to providing decisioning support and prescriptive tools to realize value.
There are near infinite numbers of ways by which well-intended and sometimes planned projects can drive off the rails. But in our experience, it almost always has to do with the difficulty to connect to the right data at the right time, to deliver the right results to the right stakeholder within the actionable time interval where the right decision can make a difference, or to incorporate the predictions and prescriptions into an effective automated process that implements the right decisions.
Sometimes, it is an overworked IT department dealing with outdated and inadequate hardware and storage technologies, trying to manage the “prevention of IT” given these other challenges. Sometimes there are challenges integrating diverse data sources that span structured data in relational databases on premise, information that needs to be accessed in the cloud or from internet-based services, with unstructured textual information stored in distributed file systems.
For example, many manufacturing customers of StatSoft need to integrate manufacturing data upstream with final product testing data, and then link it to unstructured warranty claim narratives that capture failures in the field stored in diverse systems. In the financial services industry, in particular the established “brick-and-mortar” players are challenged to build the right systems to capture all customer touch points and connect them with the right prediction/prescription models, to deliver superior services when they are most needed.
So in short, the data may be there, the technologies to do useful things with those data exist (and are comprehensively available in StatSoft’s products), but the two cannot readily be connected. It is generally acknowledged that data preparation consumes about 90% or more of the effort in analytic projects.
Completing the value chain
That is why we are excited at StatSoft to be part of Dell, and why our customers almost immediately “get it”: Dell hardware, combined with the cutting edge tools and technologies in Dell’s software stack, combined with Dell’s thought leaders and effective services across different domains, and now combined with StatSoft’s tools and solutions for predictive and prescriptive analytics deliver the only ecosystem of its kind that can integrate very heterogeneous data sources, and connect them to effective predictive and prescriptive analytics. It does not matter if, as is the case in the real world, these data sources are structured or unstructured, involve multiple data storage technologies and vendors, are implemented on-prem or cloud based. We can deliver solutions based on robust hardware with cutting-edge software and effective and efficient services, combined with the right analytics capabilities to drive effective action.
So pausing for a moment to reflect on this, I cannot really think of any other provider of these capabilities that can complete the data-to-insight-and-action value chain for driving competitive advantages to all businesses small or large. StatSoft’s motto was “Making the World more Productive” which naturally goes with Dell and the Power to do more.
This will be an exciting time going forward for StatSoft and Dell, and our customers.
Credit Scoring at Novum Bank: Data Mining defines success in high risk lending

Original article by Marcel Wiedenbrugge
A New Gold Rush Is On. Who Will Strike It Rich?

Original article by Michael Dell of Dell
Data is arguably the most important natural resource of this century. Top thinkers are no longer the people who can tell you what happened in the past, but those who can predict the future. Welcome to the Data Economy, which holds the promise for significantly advancing society and economic growth on a global scale.
Big data is big news just about everywhere you go these days. Here in Texas, everything’s big, so we just call it data. But we’re all talking about the same thing—the universe of structured data, like transactional information in databases, and also the unstructured data, like social media, that exists in its natural form in the real world.
Organizations of all sizes are trying to figure out how to use all of this data to deliver a better customer experience and build new business models. Consumers are struggling to balance a desire for automated, personalized services with the need for safety. Governments are pressured to use all available data in support of national security, but not at the expense of citizens’ right to privacy. And underlying it all is the realization that data, if managed, secured and leveraged properly, is the pathway to progress and economic success.
So who will strike it rich in this new, data-driven gold rush? It will invariably be those who are willing to accept the new realities of the Data Economy. Business instincts and intuition are being augmented and increasingly replaced by data analysis as the drivers of success. We’ve seen it at Dell. Our marketing team uncovered more than $310 million in additional revenue last year through the use of advanced analytics. This year, we expect that number to exceed half-a-billion.
We believe that’s just the tip of the iceberg, and we’re accelerating our strategy. Recently we announced the acquisition of StatSoft, a leading provider of data mining, predictive analytics and data visualization solutions. It is yet another investment in our enterprise solutions, software and services portfolio specifically designed to help our customers turn data into action.
But contrary to popular opinion, the data economy isn’t just for global enterprises like Dell. A Dell-commissioned study that we will announce later this month found that mid-market companies are increasingly investing in data projects to drive better decision making and better business results. We have also found that startups that use technology more effectively create twice as many jobs on average and are more productive and profitable than companies that don’t.
At their core, entrepreneurs are all about solving problems, and nothing provides a better window into problems than data. Consider the popularity of Global Positioning System (GPS) technologies. The simple act of connecting to and delivering data paved the way for many successful businesses that in turn created an entirely new segment of the economy.
The day is near when the use of data analytics will simply become the price of remaining viable and competitive in the global marketplace. There is still a lot of uncertainty about the Data Economy, but this much is clear: the opportunity for data-driven organizations is golden.
STATISTICA | Video Tutorials
 No need to feel lost getting started with STATISTICA! We’ve got you covered with our popular videos on text mining, data mining, and all things analytic
How to Show Grouping in Scatterplots
 A scatterplot shows the relationship between continuous variables. Applying a grouping factor adds yet another dimension that can greatly enhance a plot’s usefulness.


Upcoming STATISTICA Training
 Dear STATISTICA user/analyst/researcher,
|
||||||||
PRICING: Academic Pricing R 4,000.00 VAT Excl per delegate
Commercial Pricing R 6,000.00 VAT Excl per delegate
INCLUDES
- Free 30-Day Installation of STATISTICA on your laptops
- Customised workshops using your own data (optional)
- Training Material
- Refreshments & lunches
- Certificates
For more information or to register for this training please phone Lorraine Edel on 011 234 6148 or 082 5678 330 or mail lorraine@statsoft.co.za
Unit 2 Petervale Centre, cor Cambridge & Frans Hals Rds, Bryanston, Johannesburg, South Africa
Phone: +27-11-656-0395; Fax: +27-11-656-0396
e-mail: lorraine@statsoft.co.za
The Dell Acquisition: Hot Topic on the Web!
 If the sheer volume of this week’s Twitter buzz is any indication, it is clear that Dell Software’s acquisition of Tulsa-based StatSoft (announced three days ago) has surprised, impressed, and befuddled many an observer of the advanced analytics space.
Within hours of Dell’s press release this past Monday morning, plenty of forward-thinking statements and opinions were already being expressed as bloggers and journalists trumpeted the information across social media channels.
For your reading pleasure, here is a short list of just some of the feedback I’ve been able to keep up with. To help you decide what to read, I have taken the liberty of noting what I found to be quick takeaways.
- Dell Boosts Big Data Holdings with StatSoft Purchase
by Todd Nevins
QUICK TAKEAWAY: Dell’s “biggest move yet”
- Dell Acquires StatSoft, Continues Push Toward Cloud and Software Services
by Shawn Hessinger
QUICK TAKEAWAY: Author wonders about impact to “small businesses.”
- Dell Acquires StatSoft
by Martin Butler
QUICK TAKEAWAY: “The StatSoft acquisition is a good move.”
- Dell Expands to Predictive Analytics with StatSoft Buy
by Jennifer LeClaire
QUICK TAKEAWAY: Includes Pund-IT Principal Analyst Charles King’s thoughts about the acquisition.
- Dell makes an uninspired acquisition of data-mining specialist StatSoft
by Derrick Harris
QUICK TAKEAWAY: Author thinks (wrongly) that corporate age and technical relevancy have an inverse relationship.
- Dell Made a Smart Move Buying StatSoft
by Virginia Backaitis
QUICK TAKEAWAY: “StatSoft holds the key that opens the door to computing’s third wave.”
- Dell jumpstarts advanced analytics strategy with StatSoft buy
by Maria Deutscher
QUICK TAKEAWAY: “Today’s acquisition of StatSoft signals [Dell’s] intent to leave the sidelines and establish a solid foothold for growth…on the mid-market.”
- Dell acquires StatSoft and the list of predictive platform vendors gets even shorter…
by Simon Arkell
QUICK TAKEAWAY: Author addresses the value and shortage of platform-based vendors (like StatSoft) as industry consolidates.
StatSoft is now part of Dell
 StatSoft is proud to announce today that we have joined forces with Dell and Dell’s Information Management Group, one of the largest providers of end-to end BI and analytic solutions in the market. As of today, StatSoft is part of the Dell organization.
End-to-end advanced analytics solutions. For StatSoft and Dell customers, this means new opportunities and capabilities to enable leading edge analytics technologies to leverage the accelerating growth of data occurring in every industry, to achieve and retain industry leadership. Turning the torrents of data into actionable information is the fundamental mission of StatSoft as well as Dell’s Information Management Group. StatSoft’s big data predictive modeling and data mining solutions for various industries, combined with Dell’s wide range of data management and software capabilities and affordable, leading-edge, and comprehensively supported x86 server platforms can deliver big data analytics at a Dell price-point for unbeatable ROI.
Dell Software already offers a host of tools to manage data and databases across structured and unstructured data sources, including products such as Toad for Oracle, Toad for SQL Server, and Spotlight on SQL Server Enterprise, as well as tools to integrate data and applications distributed across the organizations, including products such as SharePlex and Dell Boomi, the latter of which was recently positioned by Gartner, Inc. in the “Leaders” Quadrant of the Magic Quadrant for Enterprise Integration Platform as a Service.
Making the World More Productive
We are excited to combine with Dell’s shared resources providing myriads of opportunities to leverage StatSoft’s analytic solutions in concert with Dell’s hardware solutions, and by way of its numerous industry relationships, including those with SAP Hana, Oracle, Microsoft SQL and PDW, and Cloudera. We are looking forward to continued growth together with our distinguished list of successful customers in practically every industry, and thank you for your support.
StatSoft Recognized in Magic Quadrant™ Announcement at BI Summit
 Information technology research and advisory firm Gartner has unveiled its Magic Quadrant for Advanced Analytics Platforms, publicly highlighting StatSoft’s position with top-tier “ability to execute” advanced solutions.
This particular quadrant report, new to Gartner’s offerings, was released February 24 in a brief session at the Gartner Business Intelligence and Information Management Summit in Sydney, Australia.
Darrel Amarasekera, Managing Director of StatSoft Pacific, was among the audience of vendors and executives, whom he described as “enthusiastic [and] very, very attentive” while Gartner Research Director Lisa Kart skimmed through the report’s contents.
Kart specifically drew the audience’s attention to StatSoft’s status as a new entrant among the top three vendors capable of executing advanced solutions. She shared with the audience some of the strengths of the STATISTICA platform. In the downloadable report (sign-in required), these strengths address STATISTICA’s wide range of functionality with a broad variety of data types; high customer satisfaction with advanced descriptive and predictive analytics; and scalability. In addition, StatSoft was reported with some of the highest evaluations for product reliability and upgrade experience, and STATISTICA was most frequently selected for license cost and speed of model deployment.
Previously, Gartner analysts had combined business intelligence with analytics in their annual Magic Quadrant research reports. However, recent industry changes with big data and predictive analytics have prompted them to develop a standalone “Advanced Analytics” category this year.
Gartner clients can access the complete Advanced Analytics Magic Quadrant report online.
STATISTICA reduces emissions spikes & associated costs with #PredictiveAnalytics at coal coking plant, pays for itself in 6 months
 New Success Story: STATISTICA reduces emissions spikes & associated costs with #PredictiveAnalytics at coal coking plant, pays for itself in 6 months. What about your industry? Click here to read full article.
