Monthly Archives: September 2013

Six Sigma

fp-banners-dnn-six-sigma

STATISTICA serves as an analytic software platform for Six Sigma programs and implementations of any size. Six Sigma’s emphasis on measurement and analysis requires a full-featured statistical analysis software system. STATISTICA provides all necessary data management, analysis, and graphics capabilities to empower the Six Sigma Green Belts, Black Belts and Master Black Belts with the analytic tools to explore data, determine the most important factors, and perform data-driven decision-making.

STATISTICA provides two categories of solutions for Six Sigma applications:

  • Desktop – designed for use from a single workstation
  • Enterprise – multi-user, collaborative, analytics platforms with security and access control, central administration, analysis templates, and automated Report generation

The Enterprise version of STATISTICA is specifically designed to facilitate collaborative work using a comprehensive (and fully configurable to the local needs and conditions) software environment. Based on state-of-the-art connectivity technologies, Enterprise/QC is designed for local and global enterprise quality control and improvement Six Sigma applications. It offers real-time monitoring and alarm notification for the production floor, a comprehensive set of analytical tools for engineers, and sophisticated reporting features for management.

The Industrial Statistics & Six Sigma menu of STATISTICA provides the power and comprehensiveness of the complete STATISTICA analytic routines; these tools are organized into groups of relevant methods according to the Six Sigma (DMAIC) Shortcuts strategy, following the DMAIC sequence of steps.

You can launch a Six Sigma toolbar with five submenus representing the five DMAIC steps:

Six Sigma Software
It also offers:

Web-enabled user interface and specific Six Sigma reporting tools and options with interactive querying tools

  • User-specific interfaces for operators, engineers, managers, and analysts
  • User-specific interfaces for all professional levels involved in the Six Sigma effort; from simple interfaces and shortcuts for support personnel, and more advanced tools for Green Belts, to the most sophisticated data analysis and data mining and graphing environment for Master Black Belts
  • Groupware functionality for sharing queries, special applications, etc. that is invaluable in the implementation of Six Sigma projects across an organization
  • Fully automated graphical monitoring of processes and quality improvements using the most advanced graphics technologies available to date
  • Integration with your data repositories including MRP, LIMS, Process Information repositories, and ERP systems

Risk Management Solutions for Energy, Oil & Gas

fp-banners-dnn-oge-risk-management


Oil, Gas and Energy companies, and more specifically their stakeholders, are being required to meet the demands of a market where greater scrutiny is being placed on regulatory requirements, of an economy that is unpredictable, and of a market that fluctuates daily while simultaneously meeting the requirements of customers with every increasing demand for energy. This required Oil, Gas and Energy companies to remain focused on customer goals and key performance indicators, making sure that they receive the right level of service. Ideally neither too much service nor too little service are delivered maximizing profit and minimizing cost. As the complexities of risk evolve with time, companies are challenged more and more to identify high-risk customers using their regular tools.

The STATISTICA Risk Management solution for the Oil, Gas and Energy industries has been proven at some of the largest and most progressive companies in the world. Our solution provides advanced analytical tools that enable Oil, Gas and Energy companies to gain more profitable customers and to decrease risks. Risk appropriate solutions are provided for complex problems unique to the Oil, Gas and Energy industry, all with the latest algorithms and technology allowing for processing of data which grows exponentially on a daily basis.

STATISTICA Solution

  • Full Range of Solutions: Data preparation, attribute building, weight of evidence coding, scorecard building, model selection, model evaluation, cut-off point selection, and population stability are all incorporated into one software package.
  • Streamlined Process: Decisioning platform solutions integrate the various tools needed to provide a comprehensive risk modeling package.
  • The Most Powerful Algorithms Available: STATISTICA incorporates not only logistic regression and Cox Proportional Hazards, but also other powerful data mining algorithms such as decision trees and neural networks, which are being incorporated into risk models.
  • Reflexive Models for RealTime Needs: Live Score® processes new customers instantly and updates risk models in rapid turn-around times made possible only by STATISTICA’s integrated solutions.

Dialect Survey Maps

105


by Win Noren

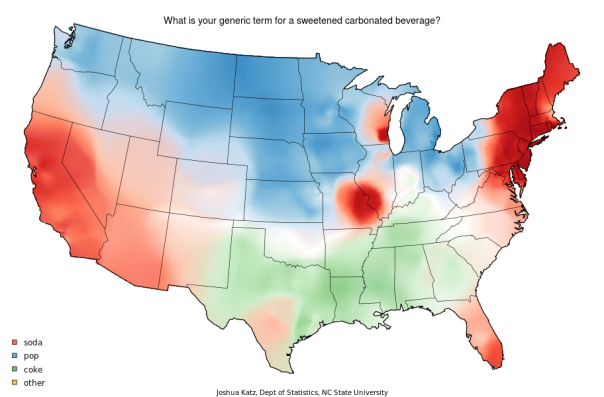
I came across a very interesting article a few weeks ago regarding visual representations of 122 linguistic differences in the speech of Americans. The maps were developed by Joshua Katz, a Ph.D. student in statistics at North Carolina State University and are a visual representation of what words are used by people across the United States to represent various concepts and how those words are pronounced.

According to an interview of Katz his interest in language dialects led him to create a statistical algorithm that weighed the responses around a particular location which allowed him to create the visually stunning heat maps showing the distribution of the various responses to each question. The summary of Katz’ end-of-the-year statistics project states: “Each observation can be thought of as a realization of a categorical random variable with a particular parameter vector that is a function of location—our goal was to interpolate among these points in order to estimate these parameter vectors at a given location, making use of a combination of kernel density estimation and non-parametric smoothing techniques. This results in a smooth field of parameter estimates over the prediction region. Using these results, a method for mapping aggregate dialect distance is developed.”

What do you call a carbonated beverage? Water fountain? Drinking fountain? Bubbler?Some of these maps are examples that everyone is familiar with (is a carbonated beverage “soda,” “pop,” or “coke”?) but others were new to me. I found looking at the maps to be visually stunning but also it caused me to think about why the people in Rhode Island and Wisconsin use the same word, “bubbler,” for “the thing from which you might drink water in a school” while the rest of the country calls it either a “water fountain” or a “drinking fountain.”

How do you address a group of people?Having lived my entire life in the Midwest (Oklahoma, Missouri, and Kansas) it was easy to see in my own responses to the questions that those of us who live here truly are a melting pot of the rest of the country as frequently the heat-map of the responses from northeastern Oklahoma were a mixture of the strong preferences in other regions of the country.

It's raining but the sun is shiningThen there were the phrases that most of the country has never heard of. For example, around here (and most of the country apparently) there is no special word for when it is raining and the sun is out. In some of the country this is called a “sun shower” although in a few locales in the south this is called “the devil is beating his wife.” Apparently the rain is her tears.

I could go on and on about the maps and how interesting I found them, but instead I encourage you to head over to the full listing yourself and check them out. You can also look up how your community’s dialect compares to the rest of the country with the Aggregate Dialect Difference maps and see who else in the country talks like you do.

Stability and Shelf Life Analysis

Standardized Stability and Shelf Life Analysis is a required step in the manufacture of all drugs and foods, to determine the shelf life. In general, the concern is that products retain the same properties and characteristics that they possessed at the time of packaging.  These properties must be within specified limits throughout a period of storage and use.

Toxicological, Microbiological, Physical and Chemical Stability and Shelf Life Studies are conducted in a wide variety of industries from Pharmaceutical, Food and Beverage, to Industrial.  Specific guidelines published by the International Conference on Harmonization of Technical Requirements for Registration of Pharmaceutical for Human Use (ICH) and also the U.S. Food and Drug Administration (FDA) provide details on analytic approaches and workflows that are acceptable for these analyses.  However, in addition to the specific data analysis steps, it is critical that analyses are validated and properly documented, and embedded into a secure system that guards the integrity of all analytic reporting.

The STATISTICA Stability and Shelf Life Analysis Solution is a validated solution which has been installed and successfully utilized at some of the largest manufacturing facilities in the world.  This solution successfully integrates enterprise-wide role-based security, predefined data configurations and analysis configurations, customizable reporting and flexible analytical tools to handle any analysis requirement.  All analyses follow ICH and U.S. FDA guidelines, meeting the stringent requirements established by these organizations.

STATISTICA Solution

  • Leading-Edge Predictive Analytics: Sophisticated algorithms to build models that provide the highest accuracy for stability and shelf life analysis.
  • Enterprise-Wide Solution: A multi-user, role-based, secure STATISTICA Enterprise platform allows for a truly collaborative environment to build, test, and deploy the best possible models for analytics.
  • Reflexive Models for RealTime Needs: Live Score® processes new data as they arrive and updates models in rapid turn-around times made possible only by STATISTICA’s integrated solutions.
  • Integrated Workflow: STATISTICA Decisioning Platform provides a streamlined workflow for powerful, rules-based predictive analytics where business rules and industry regulations are used in conjunction with advanced analytics to build the best models.

STATISTICA Text Miner

STATISTICA Text Miner is an optional extension of STATISTICA Data Miner, ideal for translating unstructured text data into meaningful, valuable clusters of decision-making “gold.”

As most users familiar with text mining already know, real-world data comes in a variety of forms, not always organized or easily ready to analyze. Text mining digs for the underlying information not readily apparent in traditional structured data.  These data sources can be extremely large as well.  STATISTICA Text Miner is optimized and has recently been further enhanced for working with such data.

How can you Use STATISTICA Text Miner ?

text mining

Example Text Miner Workspace
Click to enlarge

  • Analyze the contents of Web pages. For example, users can automatically process and summarize all Web pages of particular companies, message boards, etc.
  • Include unstructured notes in predictive data mining projects. For example, users may include responses to open-ended interview questions, patients’ own descriptions of medical symptoms, etc. in data mining projects involving the clustering of patients and symptoms.
  • Analyze large document repositories. For example, users may analyze repositories of documents such as narratives of insurance claims, etc., to include such information in fraud detection projects.

STATISTICA Text Miner was specifically designed as a general and open-architecture tool for mining unstructured information. The feature extraction/selection and other analytic tools available in STATISTICA Text Miner are not only applicable to text documents or Web pages, but can also be used to index, classify, cluster, or otherwise include in your analyses unstructured information such as (pre-processed) bitmaps imported as data matrices, etc..

  • Accessing Documents
  • Processing Documents
  • Analyzing Documents

Integration with STATISTICA, STATISTICA Data Miner, and STATISTICA Enterprise

The text miner software is fully integrated into the STATISTICA line of software. It is not a stand-alone product manufactured by another vendor and “connected” to STATISTICA. Text mining functionality can be integrated into the STATISTICA Data Miner workspace environment, STATISTICA Enterprise, or custom STATISTICA applications.

For example a customer may:

  • automatically access data stored in a data warehouse
  • update certain analyses and numeric summaries of the textual information
  • publish results to authorized users via the Internet

It is scalable and uses multi-threaded computing technology to extract optimum performance from advanced multiple-processor server hardware.

Predictive Maintenance

fp-banners-dnn-predictive-maintenance


Physical maintenance issues can cause costly disruptions in the manufacturing process. With predictive analytics tools, however, repairs and maintenance tasks are prioritized based on real-time probabilities of when various failures are likely to occur. This strategy of predictive maintenance saves time and money and helps minimize costly production downtime. It can also improve personnel safety and equipment longevity.

STATISTICA Decisioning Platform® manages a set of failure prediction models for each potential issue that could arise. With constant monitoring of such large sets of production variables, businesses are staying on top of maintenance needs and addressing them in strategic and effective ways. The STATISTICA Enterprise and MAS tools keep constant track of progress, send alerts, auto-update prediction models, and keep things running smoothly.

STATISTICA Solution

  • Predict Impending Machine Failure: Build predictive models that indicate the likelihood of various machine failures at all stages of the manufacturing process.
  • Prioritize Maintenance:  Identify primary maintenance issues requiring immediate attention and secondary issues that can wait.
  • Keep Predictive Models Up to- Date: Models are updated automatically to take advantage of new data in changing processes.
  • Deploy Prescriptive Analysis: Develop a prescriptive analysis plan that suggests appropriate actions based on different failure types.
  • Find Root Causes of Machine Failures: Find the key factors that contribute to machine wear and unscheduled maintenance.

Rate Making

fp-banners-dnn-insurance-rate-making


Rate Making

In rate making, it is important to accurately estimate the frequency and severity of expected claims so that premiums are set properly. The premiums need to adequately cover payouts while providing a competitive cost to the customer. The bottom line is, risk and the expected value of payouts must be accurately estimated to set optimal pricing.

STATISTICA offers predictive model building tools applicable in a variety of areas including underwriting, rate making, claim management, and fraud detection. In addition, STATISTICA Enterprise allows the company to automatically monitor and alert when patterns change. This helps to stay ahead of factors that will influence premiums. Forecast models may be enhanced by the addition of unstructured text information to the predictive variable pool.

STATISTICA Solution

  • Understand and model risk: From traditional statistical procedures to complex data mining algorithms, STATISITCA offers all the tools needed for actuarial analysis.
  • Find anomalies that may indicate fraud: Tools like principal component analysis and clustering reveal claims that are different from the majority.
  • Improve analysis by adding free form text: STATISTICA Text Miner allows you to harness the value hidden in free form text and enhance the analysis.
  • Visualize the data and results: STATISTICA offers high powered, easily customizable graphics for exploring the data and displaying the results.
  • Automatically monitor metrics that indicate changes in risk: STATISTICA Enterprise automates data retrieval and analyses, sending alerts when necessary.
  • Real-time scoring from predictive models: STATISTICA Live Score gives instant access to deployment of the predictive models of risk.

Predictive Patient Management

fp-banners-dnn-readmissions


Predictive Patient Management

Healthcare and the delivery of healthcare services is undergoing major structural changes in the US and worldwide. These changes—driven by the need to deliver more effective treatments more economically in order to control cost—create new demands and challenges for hospitals, health plan providers, insurers, and medical professionals at all levels. As electronic medical record (EMR) systems collect more and more data, what is needed is an effective analytics platform that leverages those data to guide better treatment strategies, predict risk such as hospital readmission risk, and supports validated analytic compliance reporting. In addition, these tools and analytic capabilities must be flexible and easy to integrate to support all available data sources, including existing IT and legacy systems which cannot easily be phased out.

The STATISTICA Solution for Predictive Patient Management provides configurable platforms to address unique challenges experienced in the healthcare industry. Comprehensive collection of analytic and graphical modules supports model building and reporting for tasks, like patient and physician profiling, recurrences and readmissions forecasting, total cost and risks estimation and many other research types.

The STATISTICA solution incorporates mature analytic templates and predictive model lifecycle management with version control and audit logs, and is built to support all common standards and interfaces, so that that the solution can be easily integrated with the existing data repositories, reporting tools, scheduling engines, etc. While many solutions in this space today require revolutionary changes to IT practices and skill sets, STATISTICA makes it easy to embrace leading edge but proven predictive modeling technology to optimize practically all activities around health care delivery.

The STATISTICA Predictive Patient Management solution combines analytics with a decisioning engine that enables direct integration of medical knowledge into modeling, enables conclusions from models in terms of prescriptions, usually referenced as prescriptive analytics. Detailed reports and logs that are maintained during routine operations ensure audit compliance.

STATISTICA Solution

  • Complete analytics and analytic reporting and BI platform: STATISTICA is extremely comprehensive and capable of supporting today’s fast-changing and highly competitive healthcare businesses which generate big data with high-velocity rates.
  • Leading-Edge Big Data Predictive Analytics: Sophisticated algorithms to build models that provide the highest accuracy for predictive patient management and best ROI.
  • Enterprise-Wide Solutions: A multi-user, role-based, secure STATISTICA Enterprise platform allows for a truly collaborative and efficient environment to build, test, and deploy the best possible models for predictive patient management.
  • Reflexive Models for RealTime Needs: Live Score® processes new data immediately and updates models in rapid turn-around times made possible only by STATISTICA’s integrated solutions.
  • Integrated Workflow: STATISTICA Decisioning Platform® provides a streamlined workflow where business rules and industry regulations are used in conjunction with advanced analytics to build powerful predictive models.
  • The system is deployed in literally hundreds of environments compliant with respective regulatory requirements.

Download STATISTICA Software Updates

textbook


Note: This page contains software updates for STATISTICA 12, 10, 9, and 8.

Visit the STATISTICA Trial page to download or request a trial.

Our current release is STATISTICA 12. To upgrade to STATISTICA 12 from earlier versions please contact lorraine@statsoft.co.za to ask about an upgrade offer.

Update STATISTICA 12

StatSoft has created a “verifier” application to simplify the update process for customers. Download this application to a computer with a STATISTICA installation. While connected to the internet run the application.

The application will verify the STATISTICA installation and download the correct installer for single user licensing. A browser will also open with installation instructions.

Customers with Multiple Users, Enterprise Server, and Enterprise Small Business Edition licensing should only run this application on their STATISTICA Enterprise server. You will see a browser window open. This page will contain the download and installation installations.
 STATISTICA Version VerifierDownload Now

The update includes changes that improve performance and compatibility and add minor enhancements.

Telecommunications

fp-banners-dnn-telecommunications

Telecommunications

In an effort to better serve and retain customers as well as increase profits, telecommunications companies are utilizing powerful data mining, text mining, and advanced analytics techniques using STATISTICA Data Miner. These tools uncover interesting patterns and relationships that are used to set pricing, forecast demand, and improve customer relationships and loyalty. Recently, a consulting firm provided a successful strategy to a telecom company, based on results of a data mining project. The success story can be read here.

Some typical predictive analytic applications for the telecommunications industry include:

  • Customer Relationship Management
    • predicting customer retention and churn,
    • Detecting relationships that aid with cross-sales, up-sales, and other marketing ventures,
    • Predicting customer lifetime value to aid in acquisition strategies
    • Customer segmentation
  • Analyzing customer feelings and sentiment through Text Mining of
    • social media analysis, Twitter and Facebook comments
    • customer feedback and reviews, and
    • inquiries to technical support
  • Forecasting of network load factoring seasonal components and holidays, forecasting sales and growth, factoring in promotional campaigns,
  • Using quality control charting to monitor customer wait time during a phone call or for service repairs or customer disconnects,
  • Root cause analysis.

STATISTICA Solution

  • Relationship Management: The STATISTICA Data Miner tool offers a variety of high power algorithms to explore the patterns and relationships in customer data. We may be interested in understanding customer churn or how to market additional products and services to new and existing customers. This task is made much easier with the help of data mining tools.High powered predictive tools such as C&RT, CHAID, Boosted Trees, Random Forests, MARSplines and Support Vector Machine can predict the probability of an individual customer disconnect as well as the overall disconnect rate. Understanding this pattern then leads to a target customer segment where we should focus to minimize customer loss. Additionally, cluster analysis can define groups of customers with similar behavior, helping to better understand the customer and their needs. This understanding can be harnessed for the purpose of customer retention.

    Cluster and link analysis can be leveraged for cross-sales and up sales. This analysis helps the telecommunications company to target the right customers for a particular marketing campaign or promotional deal.

  • Sentiment Analysis: Understanding of the customer base is very beneficial to the relationship between the telecommunications company and its customers. STATISTICA Text Miner can help make short work of analyzing the buzz on social media such as Facebook, Twitter user forums, etc. Sentiment analysis helps the company to gauge their overall impression in the market.Text Mining of customer feedback and reviews can find patterns easily missed otherwise. For example, what products or services are mentioned most often in negative reviews? Or in positive reviews? Perhaps patterns detected in text mining of technical support and service repair notes can reveal areas for improvement.
  • Forecasting: STATISTICA Data Miner features several tools for forecasting such as Neural Networks Time Series, and traditional Time Series tools like ARIMA, Exponentially Weighted Moving Average, Fourier analysis, and many others. Using these tools, telecommunication companies can model the trends that affect network demands. Having a clear picture of future demand helps to devise a good strategy for marketing and resource management.
  • Monitoring: Telecommunications companies can monitor and track important metrics such as call volume, tower load, customer wait times, and service disconnects. Typical applications include monitoring processes, finding important controllable factors and anticipating issues before they occur.

    Areas of Application: Monitoring Processes with STATISTICA Enterprise QC and MAS

    STATISTICA Enterprise QC monitors the various critical processes that are taking place within the telecommunications company, such as call volume and tower load. Immediate alerting of spikes can allow the company to react quickly so that the fewest customers are negatively affected by temporary outages.

    STATISTICA Monitoring and Alerting Server (MAS) provides automated monitoring and dashboard summaries for highly automated processes within the telecommunications organization.

    Anticipating Issues before they occur with STATISTICA Process Optimization and Root Cause Analysis

    Anticipating Issues before they occur with STATISTICA Process Optimization and Root Cause Analysis


    STATISTICA Process Optimization and Root Cause Analysis is an exceptional tool for monitoring a process at each step along the way, even anticipating quality control problems with unmatched sensitivity and effectiveness. By integrating cutting-edge predictive modeling and data mining techniques with the vast array of traditional quality tools including quality control charting, process capability analysis, experimental design procedures and Six Sigma methods, STATISTICA Process Optimization and Root Cause Analysis allows for complete process understanding, root cause analysis, and accurate predictions of quality outcomes during the manufacturing process.

    STATISTICA Process Optimization and Root Cause Analysis allows you to take advantage of existing historical data and find patterns in the data that affect the process. Tower load, for example is a complex process, reliant on many factors and interactions. A traditional experimental design to find the driving factors is likely not feasible. Root Cause analysis uses your historical data to find factors and combinations of factors that affect the end product quality.

    STATISTICA Process Optimization and Root Cause Analysis builds predictive models that reflect the relationship between inputs and outcomes of the process. The models can then be used to simulate runs, finding optimal settings and improving overall quality of the process.